

With home prices continuing to deliver double-digit increases, some are concerned we’re in a housing bubble like the one in 2006. However, a closer look at the market data indicates this is nothing like 2006 for three major reasons.
1. The housing market isn’t driven by risky mortgage loans.
Back in 2006, nearly everyone could qualify for a loan. The Mortgage Credit Availability Index (MCAI) from the Mortgage Bankers’ Association is an indicator of the availability of mortgage money. The higher the index, the easier it is to obtain a mortgage. The MCAI more than doubled from 2004 (378) to 2006 (869). Today, the index stands at 130. As an example of the difference between today and 2006, let’s look at the volume of mortgages that originated when a buyer had less than a 620 credit score.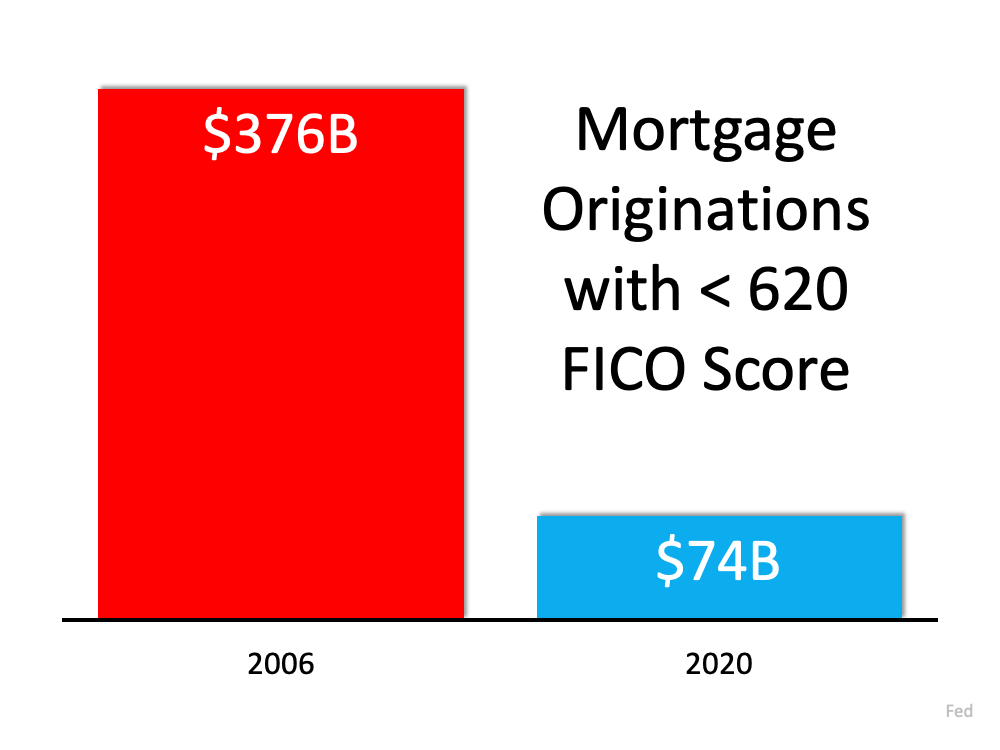 Dr. Frank Nothaft, Chief Economist for CoreLogic, reiterates this point:
“There are marked differences in today’s run up in prices compared to 2005, which was a bubble fueled by risky loans and lenient underwriting. Today, loans with high-risk features are absent and mortgage underwriting is prudent.”
2. Homeowners aren’t using their homes as ATMs this time.
During the housing bubble, as prices skyrocketed, people were refinancing their homes and pulling out large sums of cash. As prices began to fall, that caused many to spiral into a negative equity situation (where their mortgage was higher than the value of the house).
Today, homeowners are letting their equity build. Tappable equity is the amount available for homeowners to access before hitting a maximum 80% combined loan-to-value ratio (thus still leaving them with at least 20% equity). In 2006, that number was $4.6 billion. Today, that number stands at over $8 billion.
Yet, the percentage of cash-out refinances (where the homeowner takes out at least 5% more than their original mortgage amount) is half of what it was in 2006.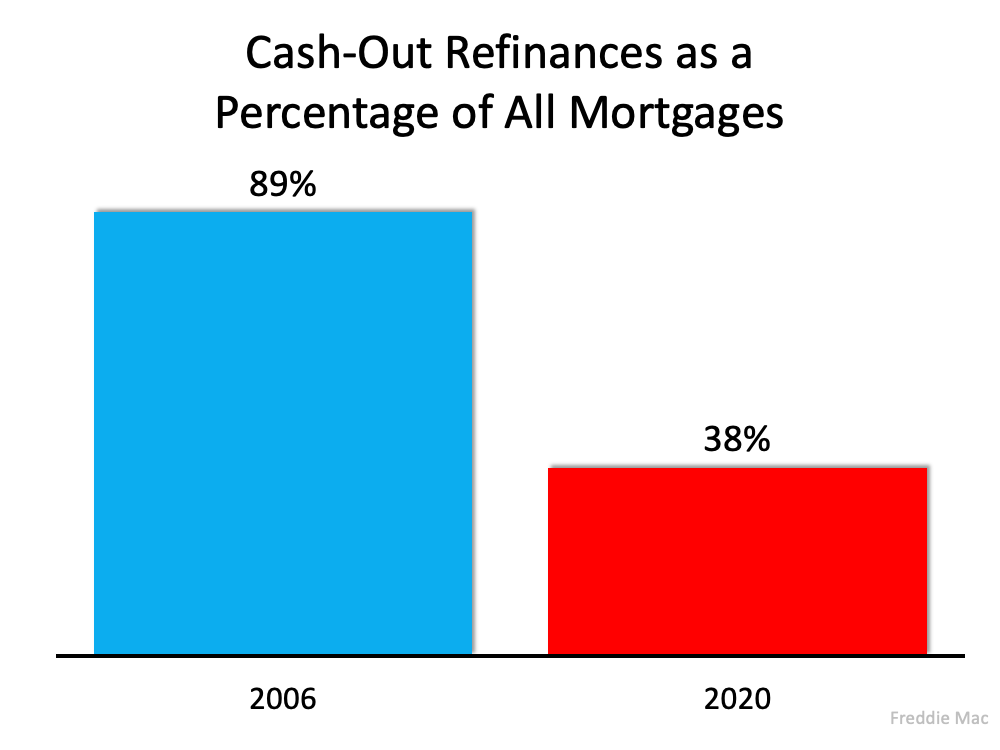
3. This time, it’s simply a matter of supply and demand.
FOMO (the Fear Of Missing Out) dominated the housing market leading up to the 2006 housing bubble and drove up buyer demand. Back then, housing supply more than kept up as many homeowners put their houses on the market, as evidenced by the over seven months’ supply of existing housing inventory available for sale in 2006. Today, that number is barely two months.
Builders also overbuilt during the bubble but pulled back significantly over the next decade. Sam Khater, VP and Chief Economist, Economic & Housing Research at Freddie Mac, explains that pullback is the major factor in the lack of available inventory today:
“The main driver of the housing shortfall has been the long-term decline in the construction of single-family homes.”
Here’s a chart that quantifies Khater’s remarks: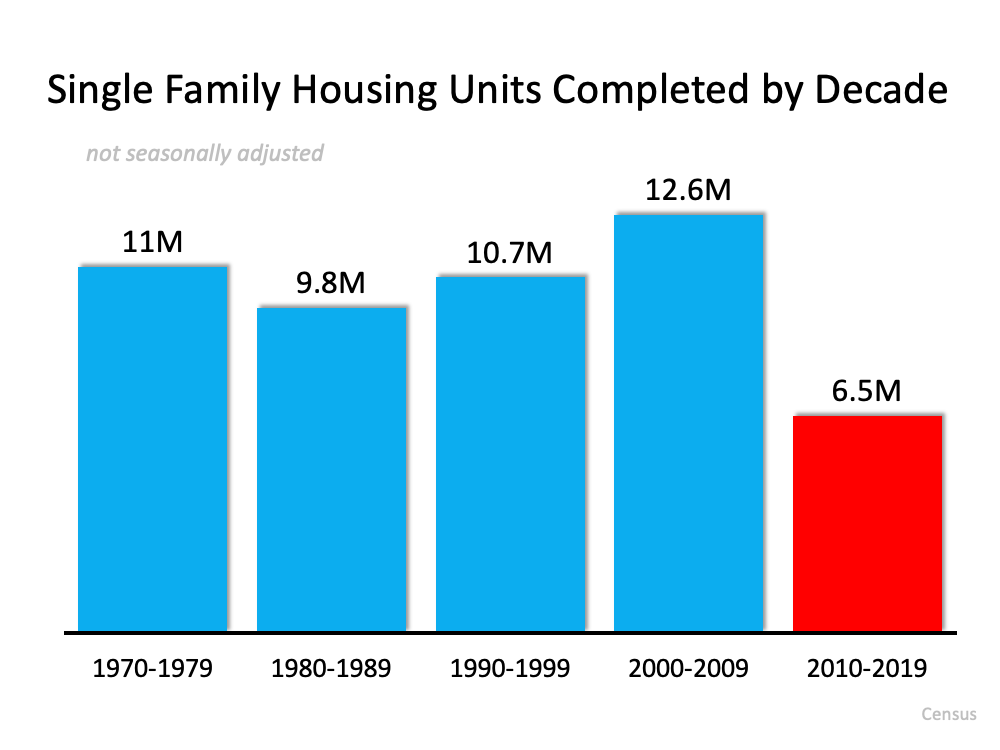 Today, there are simply not enough homes to keep up with current demand.
Bottom Line
This market is nothing like the run-up to 2006. Bill McBride, the author of the prestigious Calculated Risk blog, predicted the last housing bubble and crash. This is what he has to say about today’s housing market:
“It’s not clear at all to me that things are going to slow down significantly in the near future. In 2005, I had a strong sense that the hot market would turn and that, when it turned, things would get very ugly. Today, I don’t have that sense at all, because all of the fundamentals are there. Demand will be high for a while because Millennials need houses. Prices will keep rising for a while because inventory is so low.”